
by David Robertson, CFA
April 2017
Because stocks are abstractions of real things rather than tangible items themselves, there tends to be something of an ephemeral nature to investing in them. As a result, one of the ongoing challenges of investing is evaluating the underlying financial strength and earnings power of companies. While accounting standards such as GAAP (Generally Accepted Accounting Principles) provide extremely useful parameters for starting an analysis, a more thorough assessment of a stock's economic value normally considers a number of adjustments to GAAP numbers.
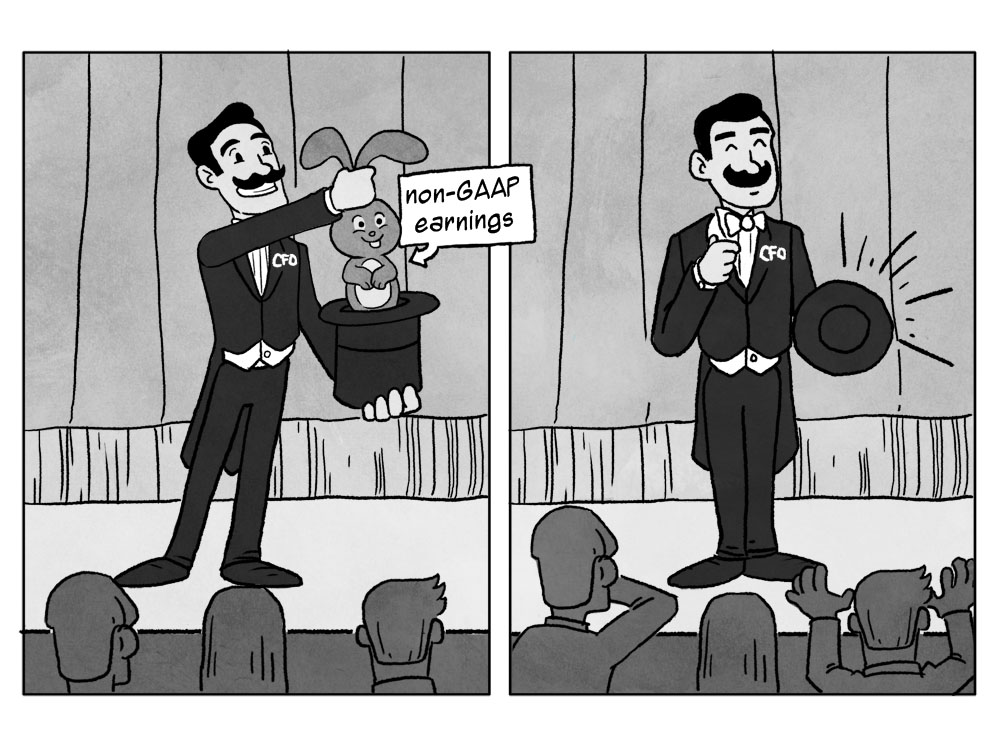
Importantly for investors, the common application of valid adjustments to GAAP numbers also opens the door for the application of less judicious adjustments. While non-GAAP numbers are occasionally used to perpetrate fraud, much more often they simply reflect efforts to present financial results in the best possible light. In either case, non-GAAP presentations can deviate from underlying cash flows, quite significantly so when the effects accumulate over multiple periods. This can create the illusion of strong performance for some intervening period of time. When such fictions are ultimately revealed, investors can be left with a distinctly unpleasant earnings surprise: now you see them, now you don't.
To be sure, the practice of adjusting GAAP accounting numbers has long been standard equipment in the analyst's toolkit and still is today. Indeed it is a critical exercise in the effort to determine a stock's intrinsic value. The practice of excluding periodic charges for restructuring or asset value writedowns, for example, is a common one because it can help create a clearer picture of ongoing operations.
Indeed, in "normal" times such activities are standard fare and accounting issues are often viewed as a boring, yet necessary aspect of business. Such views belie a deeper reality, however. As the Financial Times highlighted [here], "Accounting numbers are like volcanoes. When they lie dormant, people forget how dangerous they can be."
Having laid dormant for some time, there are now indications that some trouble is brewing. For instance, the Financial Times reports [here], "According to research company Audit Analytics, 96 per cent of companies in the S&P 500 presented non-GAAP metrics in their earnings releases in the fourth quarter of last year. That was up from 88 per cent in the third quarter."
On one hand, it isn't all that surprising that so many companies adjust their earnings presentations - they certainly have incentives to do so. They compete with other companies for capital and many, if not most, executives receive bonuses based on financial performance. While GAAP standards allow management teams some flexibility in how they present performance, non-GAAP numbers provide enormous latitude.
On the other hand, when the economy is running well and companies are growing, there is little need to tamper with good results. That temptation increases mainly when the pressures of more difficult business conditions impinge upon financial results. As a result, the trend of increasing non-GAAP presentations if often a sign of weakening fundamentals.
Not surprisingly, The FT also reports, "Most of those non-GAAP numbers make the company look better. Last year a FactSet study found that the average difference between non-GAAP and GAAP profits reported by companies in the Dow Jones Industrial Average was 31 per cent, up from 12 per cent in 2014." The numbers should immediately raise eyebrows due to the significant sequential increase as well as the magnitude of the 31 per cent chasm between GAAP and non-GAAP numbers.
The recent spate of non-GAAP adjustments is especially interesting in the context of a recent change in accounting standards. Specifically, the Financial Accounting Standards Board (FASB) eliminated the concept of extraordinary items for companies with fiscal years after December 15, 2015 [here].
For reference, the requirements to be considered an "extraordinary item" according the old FASB rules were strict: events had to be both "unusual in nature" and "infrequent in occurrence." Indeed FASB noted that part of the rationale for abandoning the standard [here] was because it is "extremely rare in current practice for a transaction or event to meet the requirements to be presented as an extraordinary item."
This exposes an interesting divergence for investors. Although the incidence rate of extraordinary items as defined by strict accounting standards has been quite low, the rate of use of non-GAAP financial presentations, which frequently feature extraordinary items, has ballooned. This pattern of increasingly liberal use of non-GAAP adjustments serves as a useful risk indicator for analysts.
One of the items more commonly considered to be "extraordinary" is that of goodwill impairment. Data provider, Calcbench, recently conducted an analysis of goodwill that they reported in a blog [here]. They reported, "Our analysis found 465 companies that disclosed goodwill impairment last year," and that "total goodwill impairment stood at $92.6 billion." They concluded, "We found that impairment is rising overall, that the average impairment is rising, and that the percentage of filers reporting an impairment is up, too."
Subsequent analysis of the Calcbench data reveals that the 2015 totals were significantly affected by very large goodwill impairments at General Electric, Microsoft and Yahoo, as well as a broad smattering across the energy industry, and declined significantly in 2016. Nonetheless, these findings contain relevant information for analysts. Goodwill impairments can indicate weaker than expected economic conditions and overly aggressive purchase prices - which can reflect on management.
Another item that typically gets lobbed into the pool of non-GAAP extraordinary items is compensation in the form of stock awards for executives. As the FT reports [here], "As public companies, executives can dole out stock with abandon." A big part of the reason is that they simply exclude the stock awards from their non-GAAP operating results.
One way to evaluate the true economic impact of stock awards is by comparing private companies to public ones. The story describes, "Once private, employees expect the same level of pay — in cash. Mr. Bravo [managing partner of private equity firm Thoma Bravo] notes that taking into account large stock payments in this way can move a profit margin of 10 per cent before interest, tax, depreciation and amortization to minus 20 per cent." The story notes, "Public shareholders have been remarkably tolerant. 'I think most investors ignore the stock comp,' says Walter Pritchard, software analyst at Citigroup. 'They don't look at profitability that way.' As Mr Pritchard points out, this means those shareholders are seeing their ownership winnowed away."
It is also important for investors to understand that accounting issues and the liberal use of non-GAAP financial results are not just the purview of smaller, less established companies. The February 10, 2017 issue of Grant's Interest Rate Observer highlights Whirlpool as a poster child of non-GAAP reporting abuses despite its status as "an American manufacturer par excellence."
Stellar margins (for North America) are only part of the Whirlpool story, however; the company is also a textbook case of chicanery with financial results. "Restructuring charges first. 'Whirlpool,' Lorenz observes, 'treats these restructuring costs as if they were oneoffs—special, nonrecurring. They are in fact recurrent ... In only three years of the past two decades (1998, 1999 and 2000) did Whirlpool not incur one of these recurring, non-recurring costs. Restructuring charges totaled $136 million in 2014, $201 million in 2015 and $173 million in 2016." The evidence indicates that Whirlpool's restructuring charges don't come within a country mile of satisfying an analytically rigorous notion of extraordinary items.
Grant's goes on to highlight the relevance of such tricks, namely the divergence of non-GAAP results from underlying cash flows: "At Whirlpool, free cash flow per share has dwindled to $7.03 in 2016 from $9.54 in 2014, a period in which the non-GAAP figures climbed to $14.06 from $11.39. Thus, the optical rise in non-GAAP earnings power has not been corroborated with a corresponding rise in FCF. More concerning, GAAP EPS, which rose to $11.50 in 2016 from $8.17 in 2014, has become increasingly separated from FCF per share, raising questions about overall earnings quality."
The result of such practices when widely practiced across the investment landscape is to occasionally facilitate meaningful divergences between perception and reality. As Michael Lewitt, noted analyst and author of The Credit Strategist, shared in his March 1, 2017 letter, "In order to make their annual argument that earnings are going to increase by double digits, analysts rely on phony non-GAAP earnings, which are at least $20 higher than GAAP earnings and are unreliable, arbitrary and intellectually dishonest but greeted with open arms by investors ..."
In sum, a key takeaway is that non-GAAP financial presentations can play a significant role in cleaving perception from underlying investment reality. The 31 per cent average difference between GAAP and non-GAAP earnings among Dow Jones companies that Factset reported is one clear indication of the magnitude of such divergences. The tech boom and bust of 2000 provides a useful illustration of the consequences. When the bubble broke, not only did multiples contract significantly, but earnings crashed too. Investors suffered a painful double whammy.
Another takeaway is that the increasing incidence of companies presenting non-GAAP results is especially troublesome since underlying results are inflated in most cases. In the context of nearly record high multiples and nearly record high corporate profits, the unfavorable trend in non-GAAP reporting represents "strike three" in terms of the margin of safety that stocks provide right now. As such, the non-GAAP phenomenon highlights both how much has to go right for stocks to maintain their price levels and, conversely, how many things can go wrong.
These trends beg the question of why non-GAAP earnings are, as Michael Lewitt puts it, "greeted with open arms by investors?" One distinct possibility is that the scrutiny of non-GAAP earnings is being systematically reduced by the trend towards passive funds. The vast majority of these funds allocate capital exclusively on the basis of size and don't consider earnings at all. As a result, most passive funds have little capacity to push back on management teams that act aggressively with accounting representations. Company management teams know this and some take advantage of the void in enforced accountability.
Another possibility is that the widespread dissemination and popularity of Wall Street earnings estimates has served to de-emphasize scrutiny of them. While such estimates can serve as a useful baseline for investors who do not have the time and resources to analyze them, they also include subjective judgments that Lewitt describes as, “unreliable, arbitrary and intellectually dishonest.”
At very least, the non-GAAP adjustments in Wall Street estimates deserve close scrutiny. This is especially so given that the sell-side analysts who produce them have plenty of incentives to flatter the results of their client companies. The fact that these estimates often get automatically propagated into various investment models creates yet another layer of insulation from scrutiny.
Finally, while there are absolutely good analytical reasons for adjusting GAAP numbers, there are also plenty of reasons that are primarily cosmetic and often deceptive. While it requires a great deal of effort and discipline to maintain the distinction, the good news is that there are good ways to measure and monitor this. If you want to avoid the magic act of disappearing earnings, the best thing you can do is to apply serious analysis to the financial numbers or hire someone who can.
April 2017
Because stocks are abstractions of real things rather than tangible items themselves, there tends to be something of an ephemeral nature to investing in them. As a result, one of the ongoing challenges of investing is evaluating the underlying financial strength and earnings power of companies. While accounting standards such as GAAP (Generally Accepted Accounting Principles) provide extremely useful parameters for starting an analysis, a more thorough assessment of a stock's economic value normally considers a number of adjustments to GAAP numbers.
Importantly for investors, the common application of valid adjustments to GAAP numbers also opens the door for the application of less judicious adjustments. While non-GAAP numbers are occasionally used to perpetrate fraud, much more often they simply reflect efforts to present financial results in the best possible light. In either case, non-GAAP presentations can deviate from underlying cash flows, quite significantly so when the effects accumulate over multiple periods. This can create the illusion of strong performance for some intervening period of time. When such fictions are ultimately revealed, investors can be left with a distinctly unpleasant earnings surprise: now you see them, now you don't.
To be sure, the practice of adjusting GAAP accounting numbers has long been standard equipment in the analyst's toolkit and still is today. Indeed it is a critical exercise in the effort to determine a stock's intrinsic value. The practice of excluding periodic charges for restructuring or asset value writedowns, for example, is a common one because it can help create a clearer picture of ongoing operations.
Indeed, in "normal" times such activities are standard fare and accounting issues are often viewed as a boring, yet necessary aspect of business. Such views belie a deeper reality, however. As the Financial Times highlighted [here], "Accounting numbers are like volcanoes. When they lie dormant, people forget how dangerous they can be."
Having laid dormant for some time, there are now indications that some trouble is brewing. For instance, the Financial Times reports [here], "According to research company Audit Analytics, 96 per cent of companies in the S&P 500 presented non-GAAP metrics in their earnings releases in the fourth quarter of last year. That was up from 88 per cent in the third quarter."
On one hand, it isn't all that surprising that so many companies adjust their earnings presentations - they certainly have incentives to do so. They compete with other companies for capital and many, if not most, executives receive bonuses based on financial performance. While GAAP standards allow management teams some flexibility in how they present performance, non-GAAP numbers provide enormous latitude.
On the other hand, when the economy is running well and companies are growing, there is little need to tamper with good results. That temptation increases mainly when the pressures of more difficult business conditions impinge upon financial results. As a result, the trend of increasing non-GAAP presentations if often a sign of weakening fundamentals.
Not surprisingly, The FT also reports, "Most of those non-GAAP numbers make the company look better. Last year a FactSet study found that the average difference between non-GAAP and GAAP profits reported by companies in the Dow Jones Industrial Average was 31 per cent, up from 12 per cent in 2014." The numbers should immediately raise eyebrows due to the significant sequential increase as well as the magnitude of the 31 per cent chasm between GAAP and non-GAAP numbers.
The recent spate of non-GAAP adjustments is especially interesting in the context of a recent change in accounting standards. Specifically, the Financial Accounting Standards Board (FASB) eliminated the concept of extraordinary items for companies with fiscal years after December 15, 2015 [here].
For reference, the requirements to be considered an "extraordinary item" according the old FASB rules were strict: events had to be both "unusual in nature" and "infrequent in occurrence." Indeed FASB noted that part of the rationale for abandoning the standard [here] was because it is "extremely rare in current practice for a transaction or event to meet the requirements to be presented as an extraordinary item."
This exposes an interesting divergence for investors. Although the incidence rate of extraordinary items as defined by strict accounting standards has been quite low, the rate of use of non-GAAP financial presentations, which frequently feature extraordinary items, has ballooned. This pattern of increasingly liberal use of non-GAAP adjustments serves as a useful risk indicator for analysts.
One of the items more commonly considered to be "extraordinary" is that of goodwill impairment. Data provider, Calcbench, recently conducted an analysis of goodwill that they reported in a blog [here]. They reported, "Our analysis found 465 companies that disclosed goodwill impairment last year," and that "total goodwill impairment stood at $92.6 billion." They concluded, "We found that impairment is rising overall, that the average impairment is rising, and that the percentage of filers reporting an impairment is up, too."
Subsequent analysis of the Calcbench data reveals that the 2015 totals were significantly affected by very large goodwill impairments at General Electric, Microsoft and Yahoo, as well as a broad smattering across the energy industry, and declined significantly in 2016. Nonetheless, these findings contain relevant information for analysts. Goodwill impairments can indicate weaker than expected economic conditions and overly aggressive purchase prices - which can reflect on management.
Another item that typically gets lobbed into the pool of non-GAAP extraordinary items is compensation in the form of stock awards for executives. As the FT reports [here], "As public companies, executives can dole out stock with abandon." A big part of the reason is that they simply exclude the stock awards from their non-GAAP operating results.
One way to evaluate the true economic impact of stock awards is by comparing private companies to public ones. The story describes, "Once private, employees expect the same level of pay — in cash. Mr. Bravo [managing partner of private equity firm Thoma Bravo] notes that taking into account large stock payments in this way can move a profit margin of 10 per cent before interest, tax, depreciation and amortization to minus 20 per cent." The story notes, "Public shareholders have been remarkably tolerant. 'I think most investors ignore the stock comp,' says Walter Pritchard, software analyst at Citigroup. 'They don't look at profitability that way.' As Mr Pritchard points out, this means those shareholders are seeing their ownership winnowed away."
It is also important for investors to understand that accounting issues and the liberal use of non-GAAP financial results are not just the purview of smaller, less established companies. The February 10, 2017 issue of Grant's Interest Rate Observer highlights Whirlpool as a poster child of non-GAAP reporting abuses despite its status as "an American manufacturer par excellence."
Stellar margins (for North America) are only part of the Whirlpool story, however; the company is also a textbook case of chicanery with financial results. "Restructuring charges first. 'Whirlpool,' Lorenz observes, 'treats these restructuring costs as if they were oneoffs—special, nonrecurring. They are in fact recurrent ... In only three years of the past two decades (1998, 1999 and 2000) did Whirlpool not incur one of these recurring, non-recurring costs. Restructuring charges totaled $136 million in 2014, $201 million in 2015 and $173 million in 2016." The evidence indicates that Whirlpool's restructuring charges don't come within a country mile of satisfying an analytically rigorous notion of extraordinary items.
Grant's goes on to highlight the relevance of such tricks, namely the divergence of non-GAAP results from underlying cash flows: "At Whirlpool, free cash flow per share has dwindled to $7.03 in 2016 from $9.54 in 2014, a period in which the non-GAAP figures climbed to $14.06 from $11.39. Thus, the optical rise in non-GAAP earnings power has not been corroborated with a corresponding rise in FCF. More concerning, GAAP EPS, which rose to $11.50 in 2016 from $8.17 in 2014, has become increasingly separated from FCF per share, raising questions about overall earnings quality."
The result of such practices when widely practiced across the investment landscape is to occasionally facilitate meaningful divergences between perception and reality. As Michael Lewitt, noted analyst and author of The Credit Strategist, shared in his March 1, 2017 letter, "In order to make their annual argument that earnings are going to increase by double digits, analysts rely on phony non-GAAP earnings, which are at least $20 higher than GAAP earnings and are unreliable, arbitrary and intellectually dishonest but greeted with open arms by investors ..."
In sum, a key takeaway is that non-GAAP financial presentations can play a significant role in cleaving perception from underlying investment reality. The 31 per cent average difference between GAAP and non-GAAP earnings among Dow Jones companies that Factset reported is one clear indication of the magnitude of such divergences. The tech boom and bust of 2000 provides a useful illustration of the consequences. When the bubble broke, not only did multiples contract significantly, but earnings crashed too. Investors suffered a painful double whammy.
Another takeaway is that the increasing incidence of companies presenting non-GAAP results is especially troublesome since underlying results are inflated in most cases. In the context of nearly record high multiples and nearly record high corporate profits, the unfavorable trend in non-GAAP reporting represents "strike three" in terms of the margin of safety that stocks provide right now. As such, the non-GAAP phenomenon highlights both how much has to go right for stocks to maintain their price levels and, conversely, how many things can go wrong.
These trends beg the question of why non-GAAP earnings are, as Michael Lewitt puts it, "greeted with open arms by investors?" One distinct possibility is that the scrutiny of non-GAAP earnings is being systematically reduced by the trend towards passive funds. The vast majority of these funds allocate capital exclusively on the basis of size and don't consider earnings at all. As a result, most passive funds have little capacity to push back on management teams that act aggressively with accounting representations. Company management teams know this and some take advantage of the void in enforced accountability.
Another possibility is that the widespread dissemination and popularity of Wall Street earnings estimates has served to de-emphasize scrutiny of them. While such estimates can serve as a useful baseline for investors who do not have the time and resources to analyze them, they also include subjective judgments that Lewitt describes as, “unreliable, arbitrary and intellectually dishonest.”
At very least, the non-GAAP adjustments in Wall Street estimates deserve close scrutiny. This is especially so given that the sell-side analysts who produce them have plenty of incentives to flatter the results of their client companies. The fact that these estimates often get automatically propagated into various investment models creates yet another layer of insulation from scrutiny.
Finally, while there are absolutely good analytical reasons for adjusting GAAP numbers, there are also plenty of reasons that are primarily cosmetic and often deceptive. While it requires a great deal of effort and discipline to maintain the distinction, the good news is that there are good ways to measure and monitor this. If you want to avoid the magic act of disappearing earnings, the best thing you can do is to apply serious analysis to the financial numbers or hire someone who can.

 RSS Feed